3. Analysis and Findings
3.1 Revenue Growth Analysis (2019-2023)
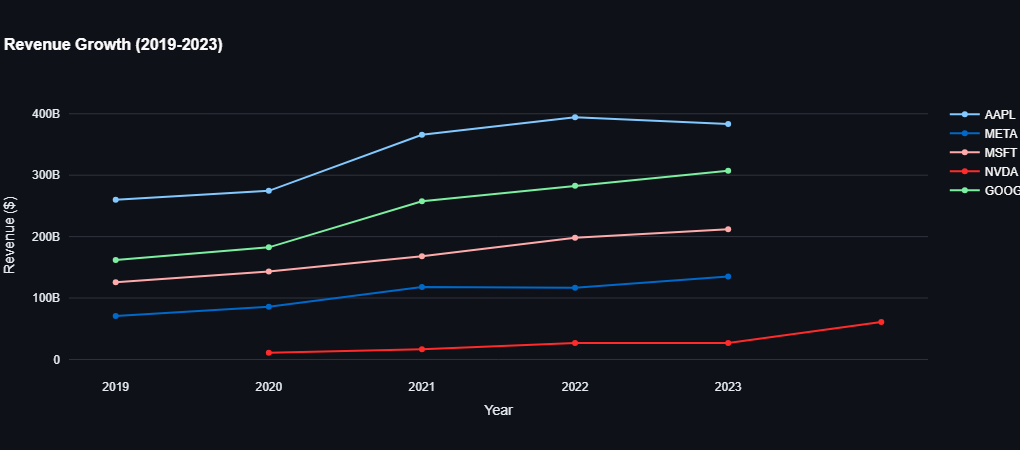
3.1.1 Company-Specific Insights
Apple (AAPL)
- 2019: Just above $200B
- 2020: Around $270B
- 2021: Around $370B
- 2022: Slight dip, just below $370B
- 2023: Slight decline continues, below $370B
Insight: Apple experienced significant growth from 2019 to 2021, with revenue peaking around 2021. However, there's a slight decline from 2022 onwards, possibly due to market saturation or increased competition in key product categories.
Meta (META)
- 2019: Around $70B
- 2020: Close to $85B
- 2021: Approximately $120B
- 2022: Slight decline, around $115B
- 2023: Stabilized at $115B
Insight: Meta's revenue shows a steady increase until 2021, followed by a slight decline and stabilization in 2022 and 2023. This pattern might reflect challenges in adapting to privacy changes and increased competition in the social media space.
Microsoft (MSFT)
- 2019: Around $130B
- 2020: Close to $150B
- 2021: Around $170B
- 2022: Close to $190B
- 2023: Steady increase, reaching about $200B
Insight: Microsoft has shown consistent growth over the five years, with a steady increase in revenue year-on-year. This consistent performance likely reflects the success of its cloud services (Azure) and the continued strength of its enterprise software offerings.
Nvidia (NVDA)
- 2019: Approximately $12B
- 2020: Close to $12B
- 2021: Around $20B
- 2022: Around $30B
- 2023: Significant jump, close to $40B
Insight: Nvidia's revenue remained flat from 2019 to 2020 but saw substantial growth from 2021 onwards, with the most significant increase between 2022 and 2023. This explosive growth likely reflects the increased demand for GPUs in gaming, cryptocurrency mining, and AI applications.
Google (GOOG)
- 2019: Around $140B
- 2020: Close to $160B
- 2021: Around $180B
- 2022: Close to $210B
- 2023: Slight increase, approximately $220B
Insight: Google has experienced steady revenue growth over the five years, with consistent increases year-over-year. This consistent growth likely reflects the company's dominance in online advertising and the growing strength of its cloud services division.
3.1.2 Comparative Insights
- Highest Revenue Growth: Apple peaked around 2021, but both Microsoft and Google have shown consistent growth without any significant dips, with Microsoft approaching $200B and Google exceeding $200B by 2023.
- Fastest Growth Rate: Nvidia, despite starting from a lower base, has shown the fastest growth rate, especially from 2021 to 2023, reflecting the booming demand in its core markets.
- Steady Performers: Microsoft and Google have been the most consistent in their revenue growth, showing a stable upward trend throughout the period, possibly due to their diversified product offerings and strong market positions.
- Peaks and Dips: Apple and Meta showed a pattern of growth followed by slight declines, whereas the others maintained or increased their growth rates, suggesting potential market saturation or increased competition in their respective sectors.
3.1.3 Conclusion
- Apple: Strong growth initially but needs to address recent declines, possibly through diversification or new product categories.
- Meta: Impressive growth until 2021, then a stabilization period, indicating a need for new growth drivers.
- Microsoft: Consistent performer with steady growth, likely due to its successful cloud strategy and enterprise focus.
- Nvidia: Exceptional growth in recent years, especially notable in 2023, riding the wave of AI and gaming trends.
- Google: Stable and consistent growth, crossing the $200B mark by 2023, demonstrating the enduring strength of its core advertising business and growing cloud segment.
3.2 Profitability Analysis
| Company | Average Net Profit Margin (2019-2023) | Profitability Image |
|---|---|---|
| Apple | 23.73% |  |
| Microsoft | 33.89% |  |
| 23.60% |  |
|
| Nvidia | 30.57% | 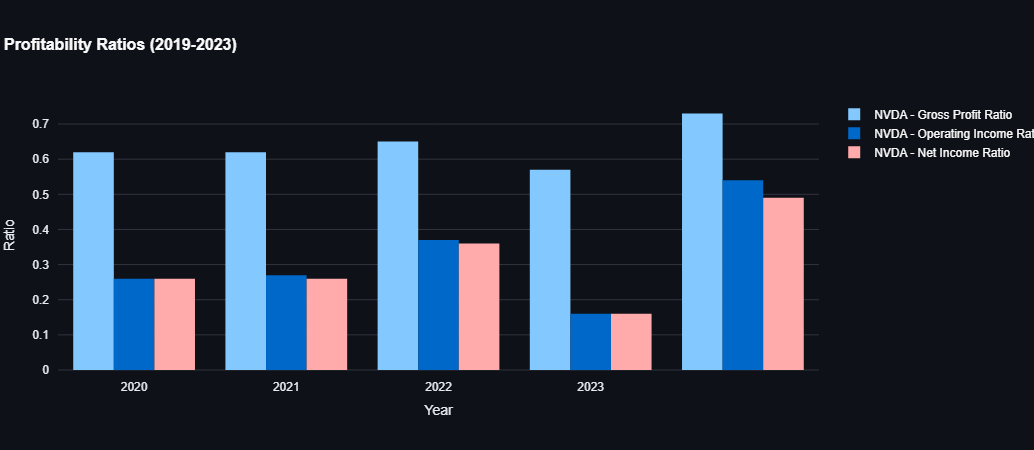 |
| Meta | 28.46% | 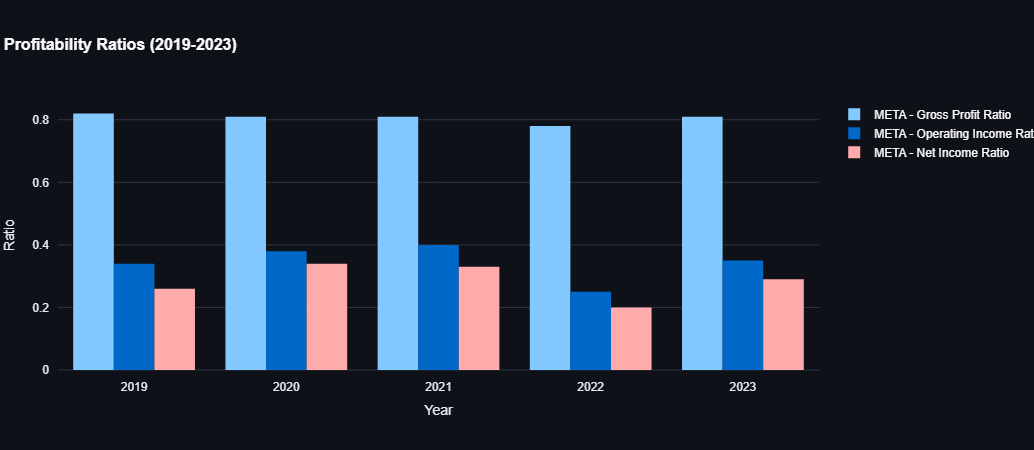 |
3.2.1 Insights
- Microsoft: Leads in profitability with an average net profit margin of 33.89%, indicating strong cost management and high efficiency in converting revenue to profit. This could be attributed to its high-margin software and cloud services.
- Nvidia: Exhibits a high average net profit margin of 30.57%, reflecting its effective scaling and high demand for its products, especially in the recent growth years. The company's focus on high-performance computing and AI chips likely contributes to this strong profitability.
- Meta: Shows a solid net profit margin of 28.46%, highlighting its ability to generate substantial profits despite fluctuations in revenue growth. This suggests efficient monetization of its large user base across its social media platforms.
- Apple: Maintains a strong net profit margin of 23.73%, showcasing its premium pricing strategy and effective control over production costs. The company's ecosystem of products and services likely contributes to this sustained profitability.
- Google: Slightly below Apple with an average net profit margin of 23.60%, indicating consistent profitability and effective cost management across its diversified services. The company's dominant position in online advertising likely supports this steady profitability.
The high net profit margins across these companies demonstrate their dominant market positions, efficient operations, and the ability to capitalize on their competitive advantages. Microsoft's leading position suggests exceptional operational efficiency, while Nvidia's strong margin reflects its growth in the tech hardware sector. Apple's and Google's profitability underscores their resilience and strategic pricing, and Meta's robust margin signifies its effective monetization strategies despite market challenges.
3.3 Liquidity and Insolvency Analysis (2019-2023)
3.3.1 Apple
| Year | Current Ratio | Quick Ratio | Cash Ratio | Days of Sales Outstanding (DSO) | Days of Inventory Outstanding (DIO) | Days of Payables Outstanding (DPO) | Cash Conversion Cycle (CCC) |
|---|---|---|---|---|---|---|---|
| 2019 | 1.54 | 1.38 | 0.46 | 64.26 | 9.26 | 104.31 | -30.79 |
| 2020 | 1.36 | 1.22 | 0.36 | 49.79 | 8.74 | 91.05 | -32.52 |
| 2021 | 1.07 | 0.91 | 0.28 | 51.39 | 11.28 | 93.85 | -31.18 |
| 2022 | 0.88 | 0.71 | 0.15 | 56.40 | 8.08 | 104.69 | -40.21 |
| 2023 | 0.99 | 0.84 | 0.21 | 58.08 | 10.79 | 106.72 | -37.85 |
Insights
Apple's liquidity ratios have generally declined from 2019 to 2022, showing a decrease in its ability to meet short-term obligations. The slight improvement in 2023 suggests a potential turnaround. The consistently negative cash conversion cycle indicates efficient working capital management.
Key observations:
- Current and quick ratios have declined, potentially indicating increased short-term liabilities or decreased liquid assets.
- Cash ratio has significantly decreased, suggesting a reduction in immediately available cash relative to current liabilities.
- The negative CCC indicates that Apple is able to sell its inventory and collect receivables before it needs to pay its suppliers, which is a sign of strong bargaining power and efficient operations.
3.3.2 Microsoft
| Year | Current Ratio | Quick Ratio | Cash Ratio | Days of Sales Outstanding (DSO) | Days of Inventory Outstanding (DIO) | Days of Payables Outstanding (DPO) | Cash Conversion Cycle (CCC) |
|---|---|---|---|---|---|---|---|
| 2019 | 2.53 | 2.35 | 0.16 | 85.63 | 17.55 | 79.80 | 23.38 |
| 2020 | 2.52 | 2.33 | 0.19 | 81.70 | 15.01 | 99.25 | -2.55 |
| 2021 | 2.08 | 1.90 | 0.16 | 82.61 | 18.42 | 105.96 | -4.93 |
| 2022 | 1.78 | 1.57 | 0.15 | 81.48 | 21.80 | 110.69 | -7.43 |
| 2023 | 1.77 | 1.54 | 0.33 | 83.86 | 13.85 | 100.28 | -2.56 |
Insights
Microsoft shows a strong liquidity position, although there's a gradual decline in current and quick ratios over the years.
Key observations:
- Current and quick ratios remain above 1.5, indicating a solid ability to meet short-term obligations.
- The cash ratio has improved in 2023, suggesting better immediate liquidity.
- The cash conversion cycle has shifted from positive to negative, indicating improved efficiency in working capital management over the years.
- Days of Payables Outstanding (DPO) has generally increased, which could indicate better terms with suppliers or a strategic decision to hold onto cash longer.
3.3.3 Google
| Year | Current Ratio | Quick Ratio | Cash Ratio | Days of Sales Outstanding (DSO) | Days of Inventory Outstanding (DIO) | Days of Payables Outstanding (DPO) | Cash Conversion Cycle (CCC) |
|---|---|---|---|---|---|---|---|
| 2019 | 3.37 | 3.25 | 0.41 | 62.00 | 5.07 | 28.23 | 38.24 |
| 2020 | 3.07 | 2.96 | 0.47 | 62.76 | 3.14 | 24.08 | 41.82 |
| 2021 | 2.93 | 2.80 | 0.33 | 57.05 | 3.85 | 19.86 | 41.04 |
| 2022 | 2.38 | 2.22 | 0.32 | 51.95 | 7.72 | 14.83 | 44.84 |
| 2023 | 2.10 | 1.94 | 0.29 | 56.95 | 0.00 | 20.51 | 36.44 |
Insights
Google maintains strong liquidity ratios throughout the period, although there's a gradual decline.
Key observations:
- Current and quick ratios remain well above 2, indicating a very strong ability to meet short-term obligations.
- The cash ratio has slightly decreased but remains healthy, suggesting good immediate liquidity.
- Days of Sales Outstanding (DSO) has improved over time, indicating more efficient collection of receivables.
- The Cash Conversion Cycle (CCC) remains positive but has improved in 2023, suggesting room for further optimization in working capital management.
3.3.4 Meta (Facebook)
| Year | Current Ratio | Quick Ratio | Cash Ratio | Days of Sales Outstanding (DSO) | Days of Inventory Outstanding (DIO) | Days of Payables Outstanding (DPO) | Cash Conversion Cycle (CCC) |
|---|---|---|---|---|---|---|---|
| 2019 | 4.40 | 4.28 | 1.27 | 49.14 | 0.00 | 38.96 | 10.98 |
| 2020 | 5.05 | 4.89 | 1.17 | 48.13 | 0.00 | 29.10 | 19.02 |
| 2021 | 3.15 | 2.94 | 0.79 | 43.45 | 0.00 | 65.80 | -22.50 |
| 2022 | 2.20 | 2.01 | 0.54 | 42.15 | 0.00 | 72.14 | -29.99 |
| 2023 | 2.67 | 2.55 | 1.31 | 43.75 | 0.00 | 68.18 | -24.43 |
Insights
Meta (Facebook) shows very strong liquidity ratios, although there's been some fluctuation over the years.
Key observations:
- Current and quick ratios remain well above 2, indicating a very strong ability to meet short-term obligations.
- The cash ratio has fluctuated but remains strong, particularly improving in 2023.
- Days of Sales Outstanding (DSO) has generally improved, indicating more efficient collection of receivables.
- The Cash Conversion Cycle (CCC) has shifted from positive to negative, suggesting improved efficiency in working capital management.
- The company consistently shows 0 Days of Inventory Outstanding (DIO), which is typical for a primarily digital service company.
3.3.5 Nvidia
| Year | Current Ratio | Quick Ratio | Cash Ratio | Days of Sales Outstanding (DSO) | Days of Inventory Outstanding (DIO) | Days of Payables Outstanding (DPO) | Cash Conversion Cycle (CCC) |
|---|---|---|---|---|---|---|---|
| 2020 | 7.67 | 7.04 | 6.11 | 55.40 | 86.10 | 60.42 | 81.08 |
| 2021 | 4.09 | 3.56 | 0.22 | 53.17 | 106.15 | 69.81 | 89.50 |
| 2022 | 6.65 | 5.96 | 0.46 | 63.06 | 100.73 | 68.95 | 94.85 |
| 2023 | 3.52 | 2.16 | 0.52 | 51.79 | 162.08 | 37.48 | 176.38 |
| 2024 | 4.17 | 3.38 | 0.68 | 59.91 | 115.99 | 59.27 | 116.63 |
Insights
Nvidia shows very strong liquidity ratios, although there's significant fluctuation over the years.
Key observations:
- Current and quick ratios are consistently high, indicating a very strong ability to meet short-term obligations.
- The cash ratio has fluctuated dramatically, from very high in 2020 to much lower in subsequent years, though still maintaining a healthy level.
- Days of Inventory Outstanding (DIO) has increased significantly, particularly in 2023, which could indicate challenges in inventory management or strategic stockpiling.
- The Cash Conversion Cycle (CCC) has generally increased, suggesting less efficient working capital management over time. This trend warrants further investigation.
3.3.6 Comparative Analysis
When comparing the liquidity and insolvency metrics of these companies, several key points emerge:
- Liquidity Strength: All five companies maintain strong liquidity positions, with current ratios consistently above 1, indicating their ability to meet short-term obligations.
- Trends: While all companies show strong liquidity, there's a general trend of declining ratios over the years, possibly indicating increased investments or changes in capital structure.
- Cash Management:
- Apple and Microsoft have shifted to negative Cash Conversion Cycles, indicating very efficient working capital management.
- Google and Meta maintain positive but decreasing CCCs, showing improvements in efficiency.
- Nvidia's CCC has increased significantly, which could be a point of concern and warrants further investigation.
- Industry Differences:
- Software and services companies (Microsoft, Google, Meta) generally show higher liquidity ratios compared to hardware-focused companies (Apple, Nvidia).
- Nvidia's high inventory days reflect the nature of its business in producing physical products, contrasting with Meta's zero inventory days as a purely digital service provider.
- Efficiency: Apple stands out with its consistently negative CCC, indicating superior efficiency in managing working capital. Microsoft has also achieved this in recent years.
Overall, while all companies exhibit strong financial health, Microsoft stands out for its consistent high liquidity, and Apple for its efficient working capital management. Nvidia's increasing CCC and high DIO might need attention, while Google and Meta show solid, stable performances with room for further optimization in working capital management.
3.4 Return on Equity (ROE)
Return on Equity (ROE) is a measure of a company's profitability that takes into account the shareholders' equity. It is calculated as Net Income divided by Shareholders' Equity. A higher ROE indicates more efficient utilization of equity capital.
In this section, we analyzed the ROE data for the period from 2019 to 2023. Let's examine each company's performance:
1. Apple
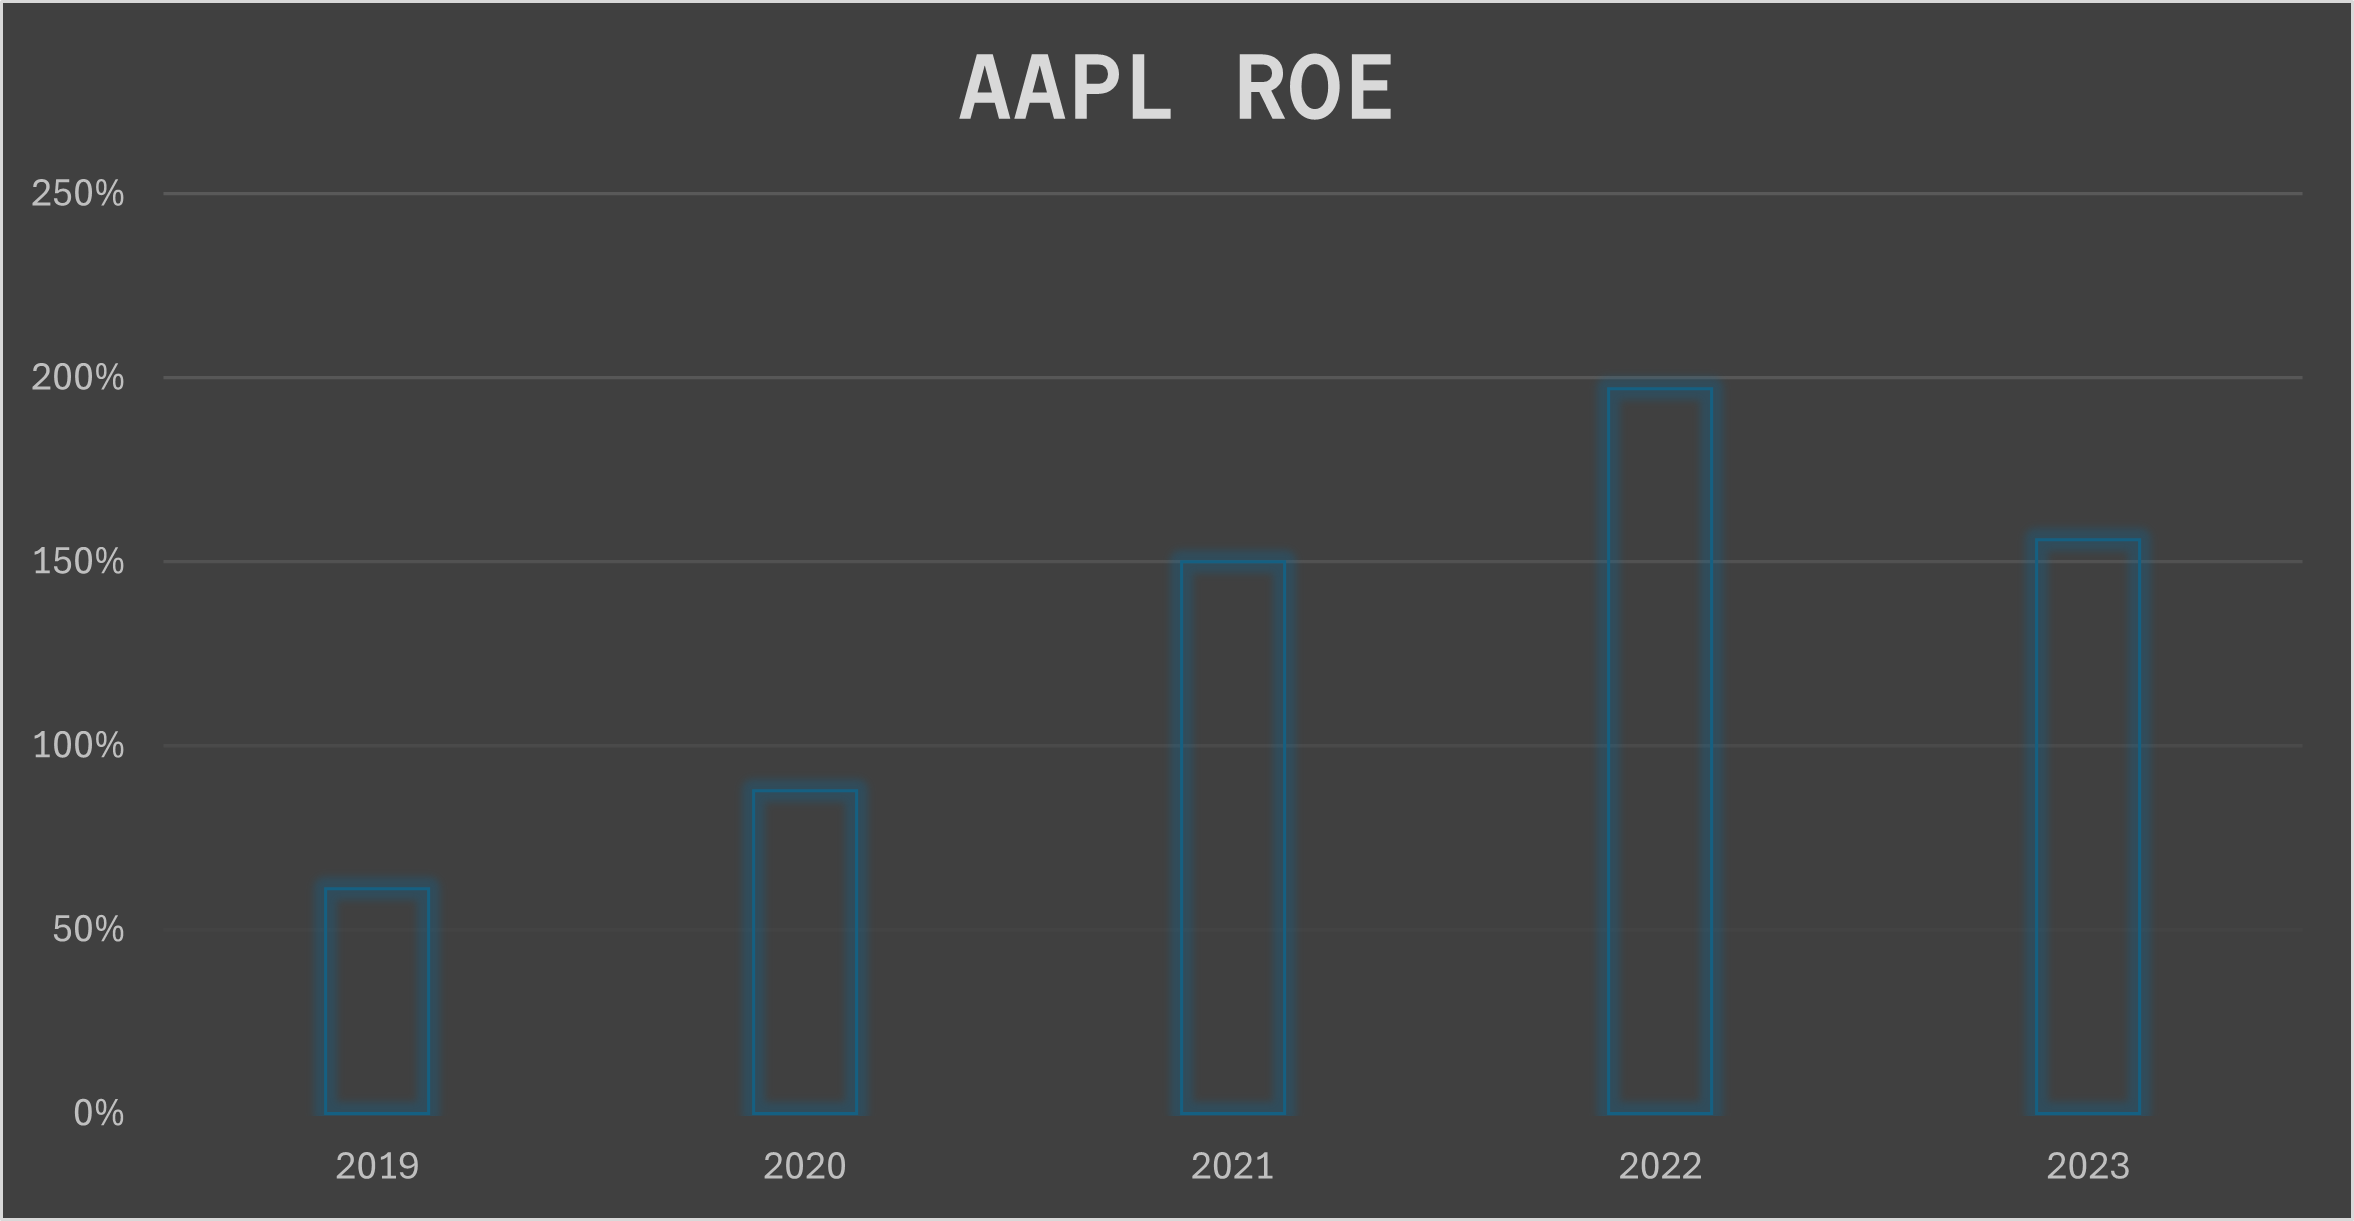
- Average ROE: 88.6%
- Apple consistently maintains a high ROE, indicating exceptional profitability and efficient use of shareholder equity.
- This reflects Apple's strong brand, innovative product line, and effective capital management.
- Note: The extremely high ROE may be partially due to Apple's significant share buybacks, which reduce shareholder equity.
2. Microsoft
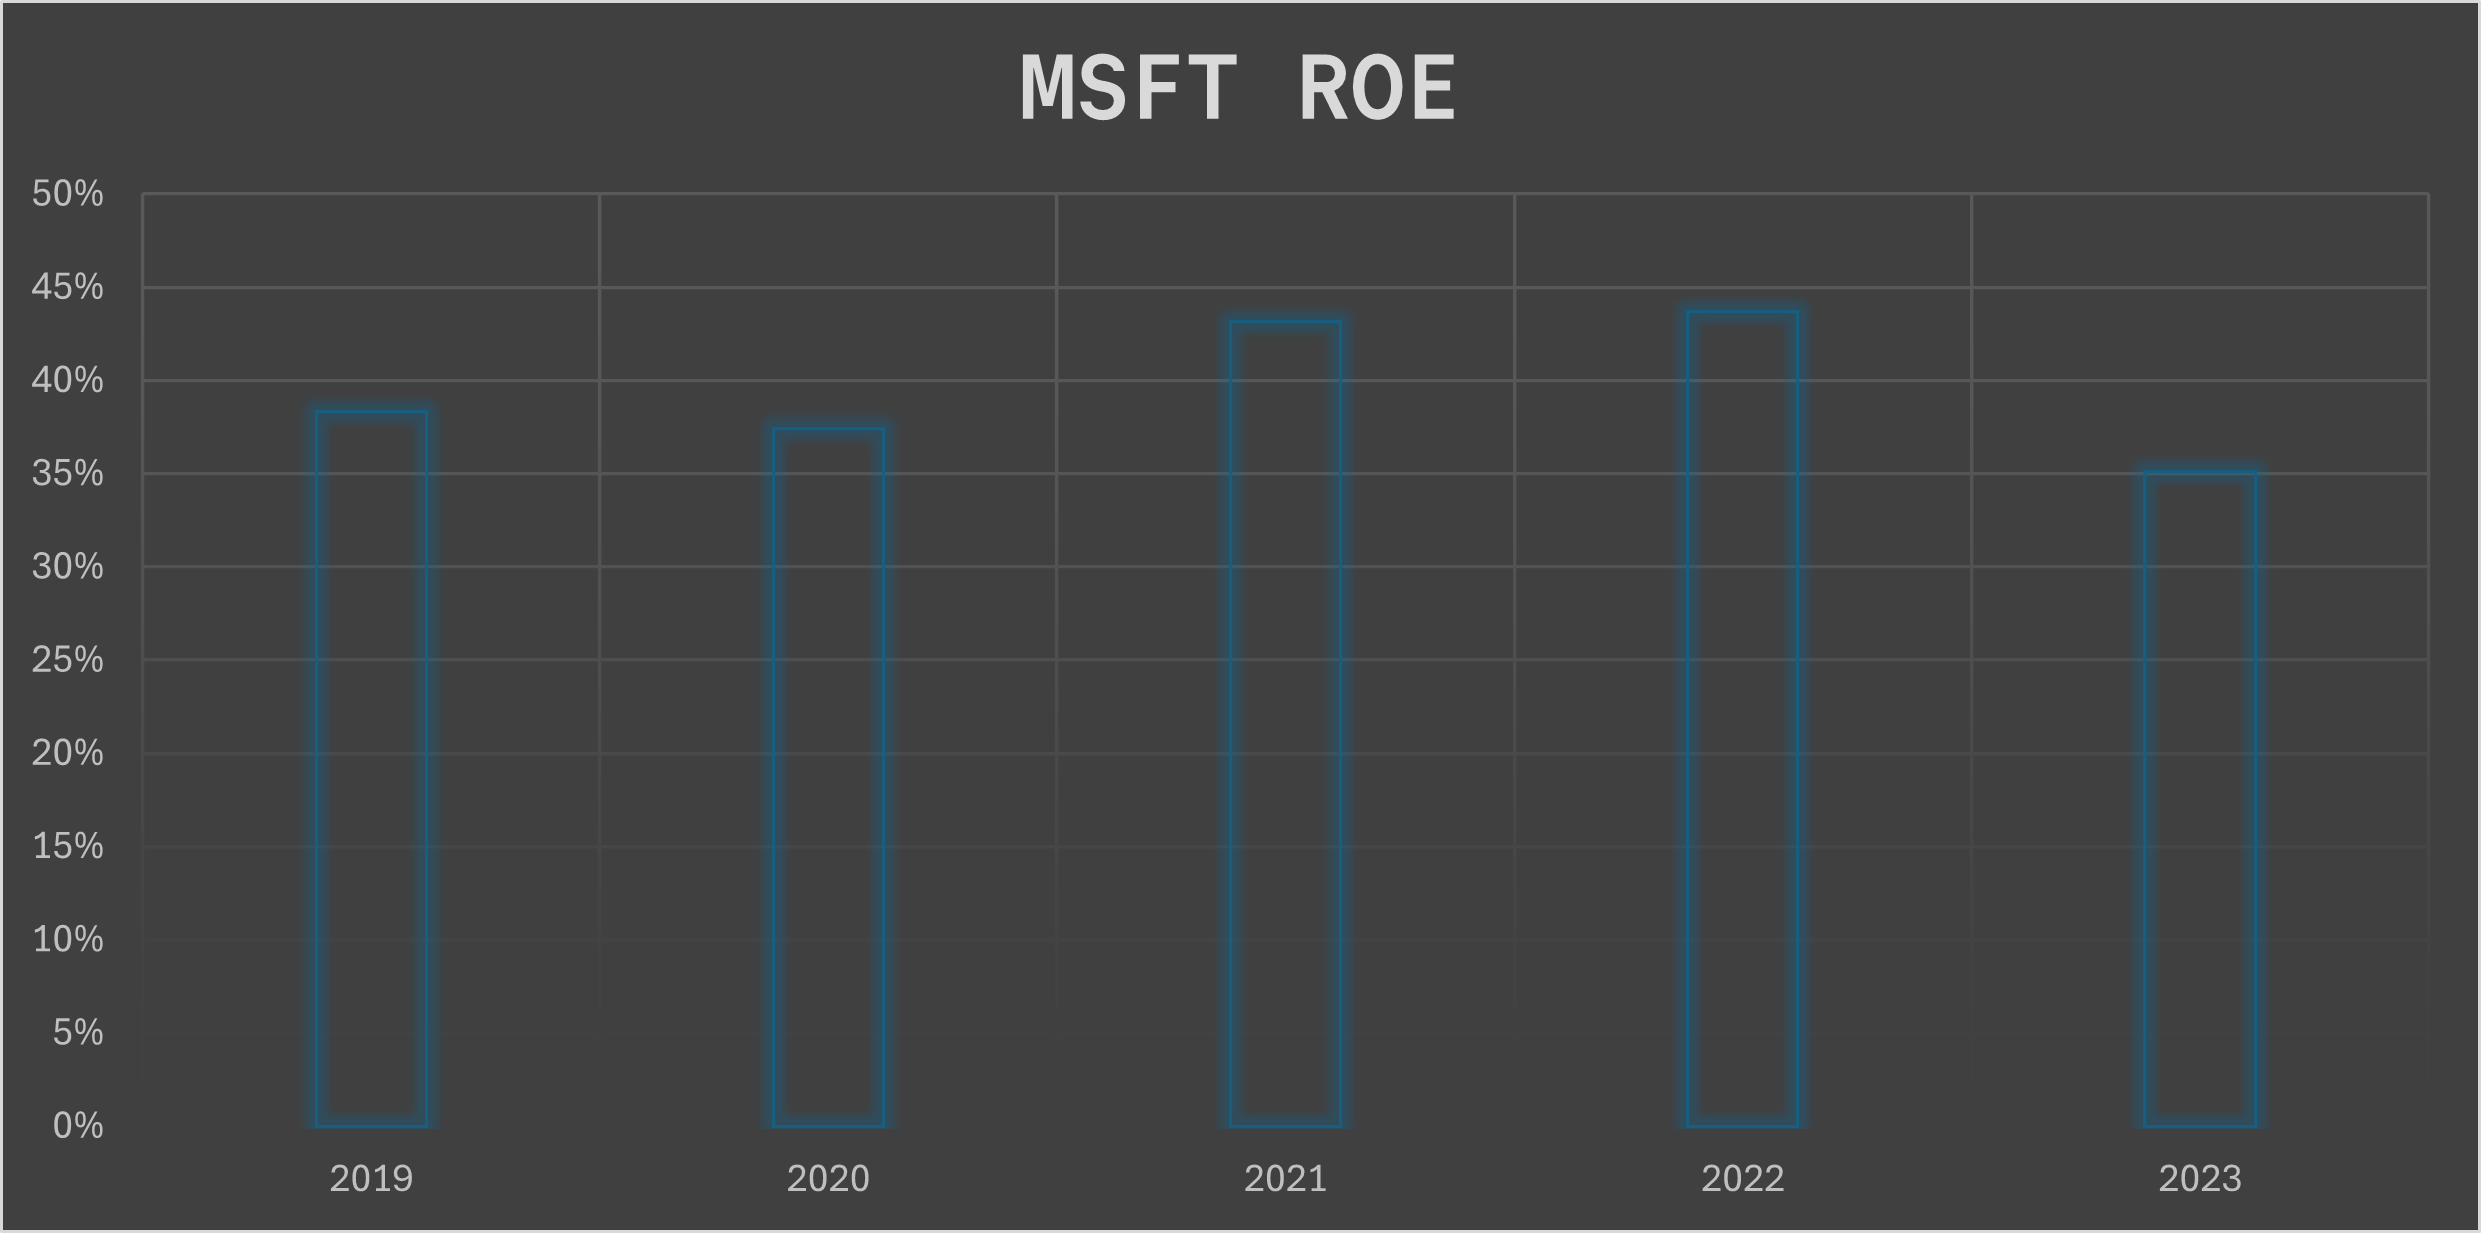
- Average ROE: 40%
- Shows steady and strong performance, indicating consistent profitability and effective use of equity.
- Reflects the success of Microsoft's cloud strategy and diversified product portfolio.
3. Nvidia
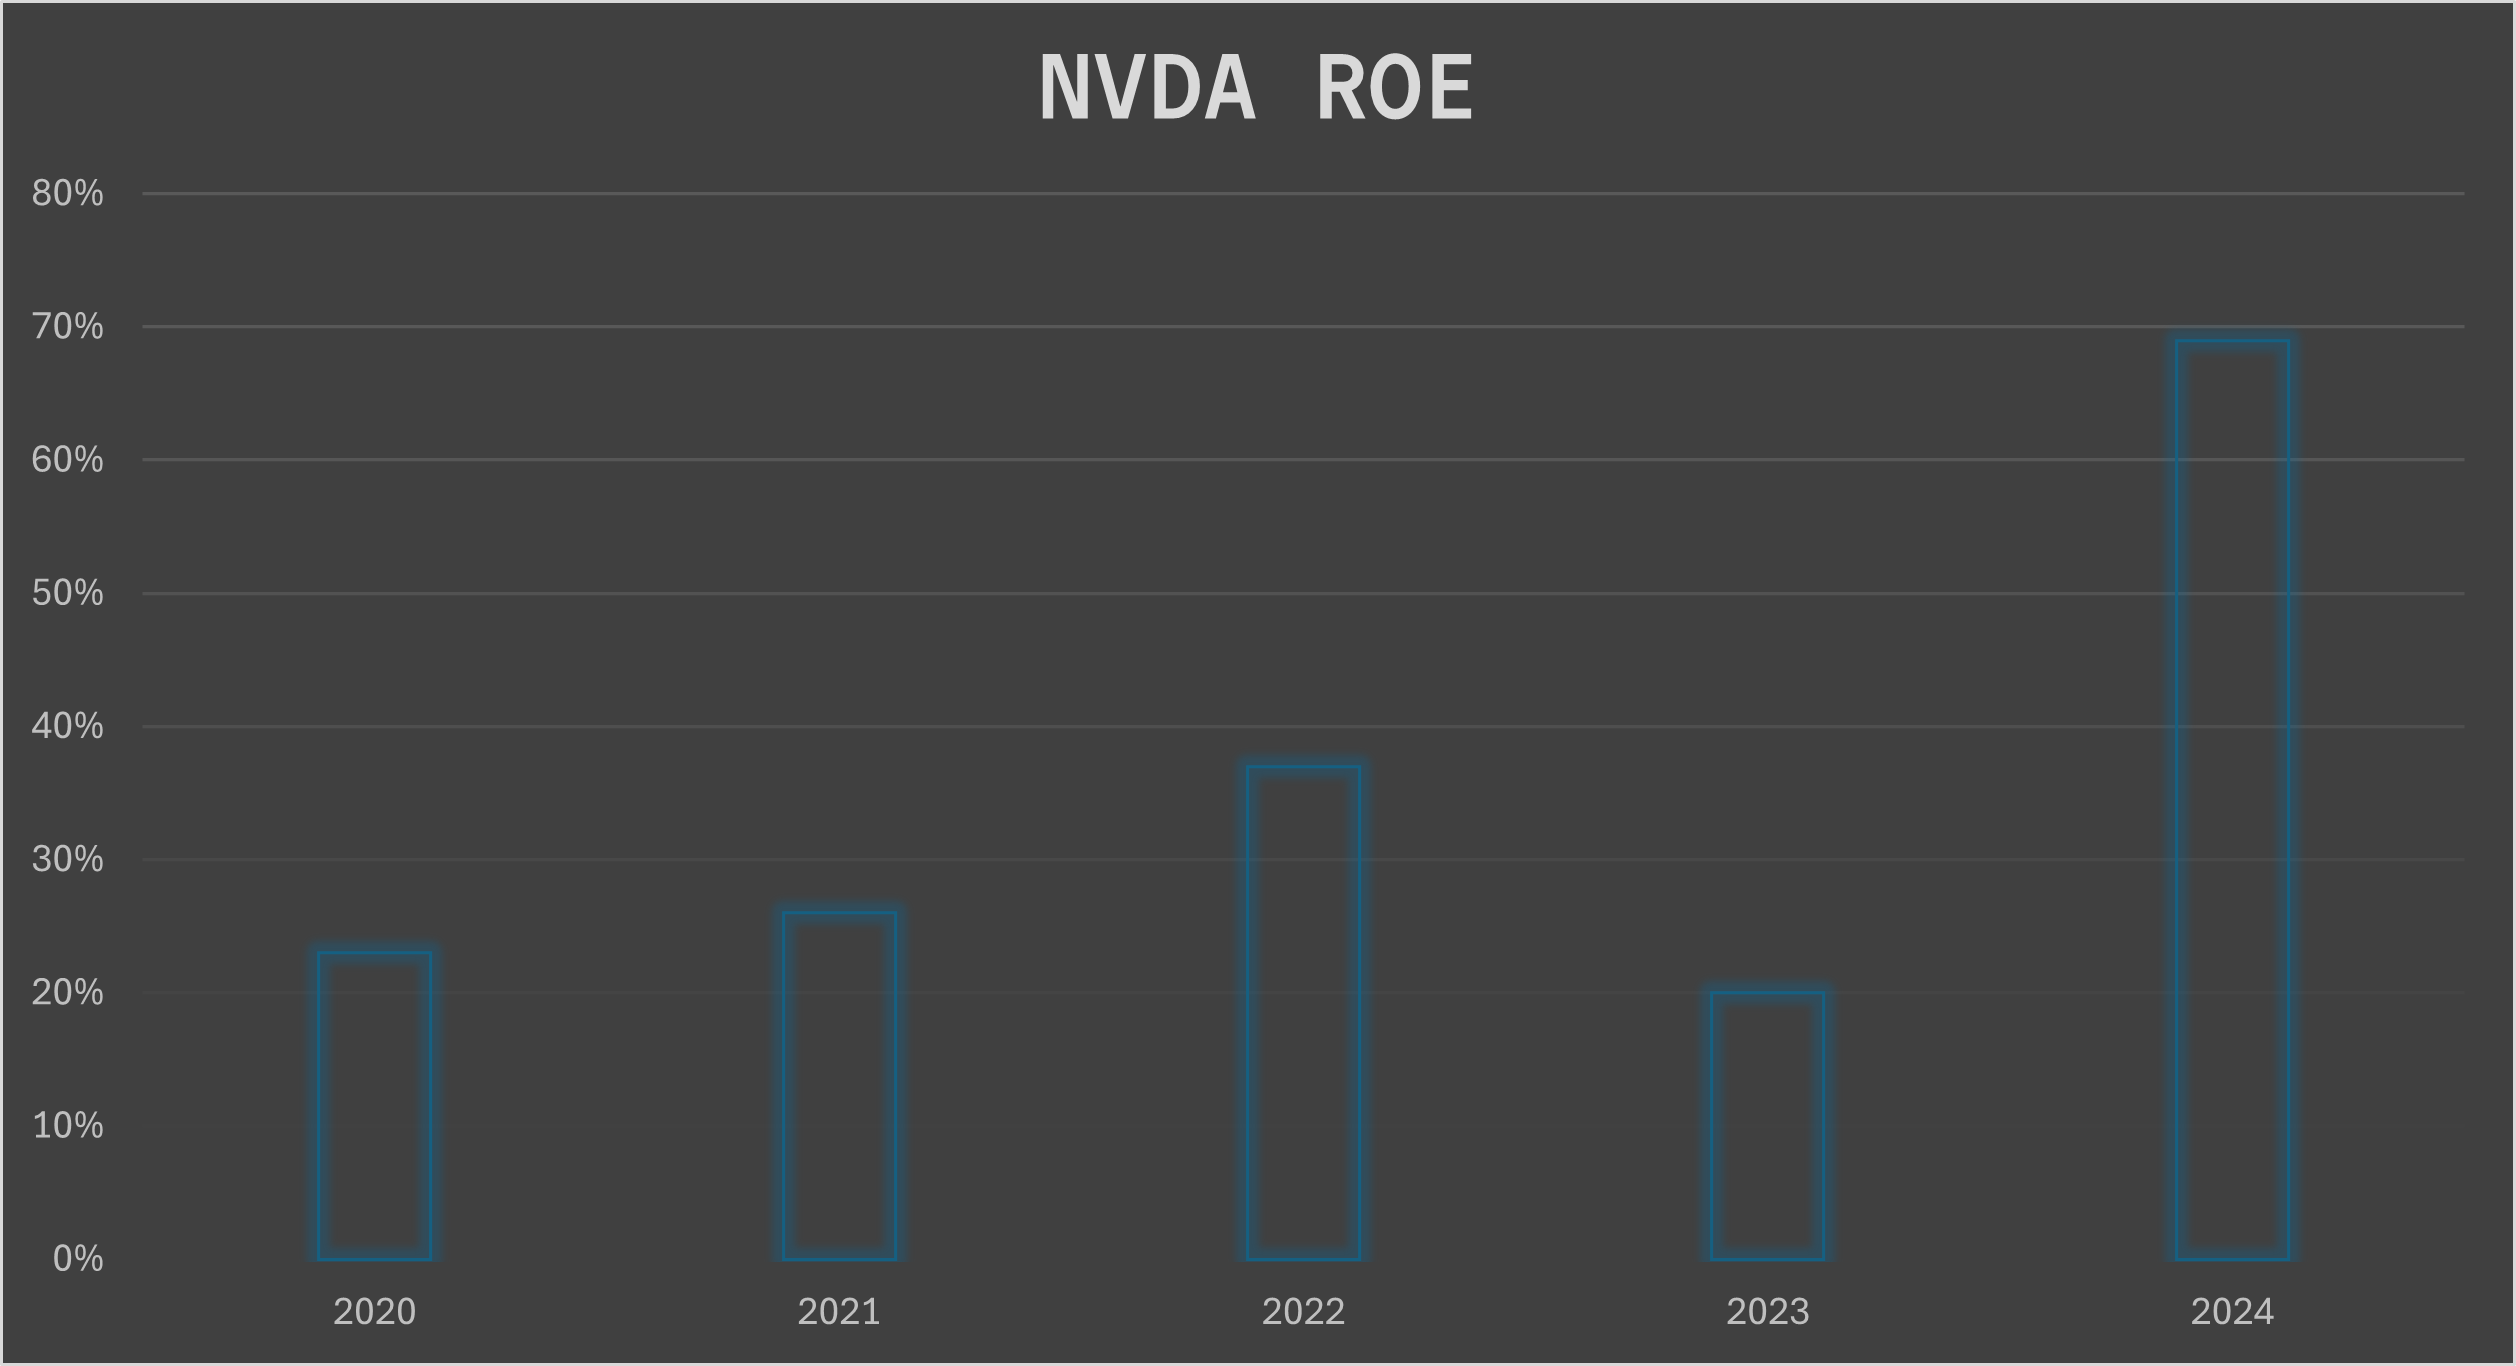
- Average ROE: 35%
- Shows a sharp upward trend, especially in recent years.
- Reflects Nvidia's growing dominance in the GPU market and expansion into AI and data center technologies.
4. Meta (Facebook)
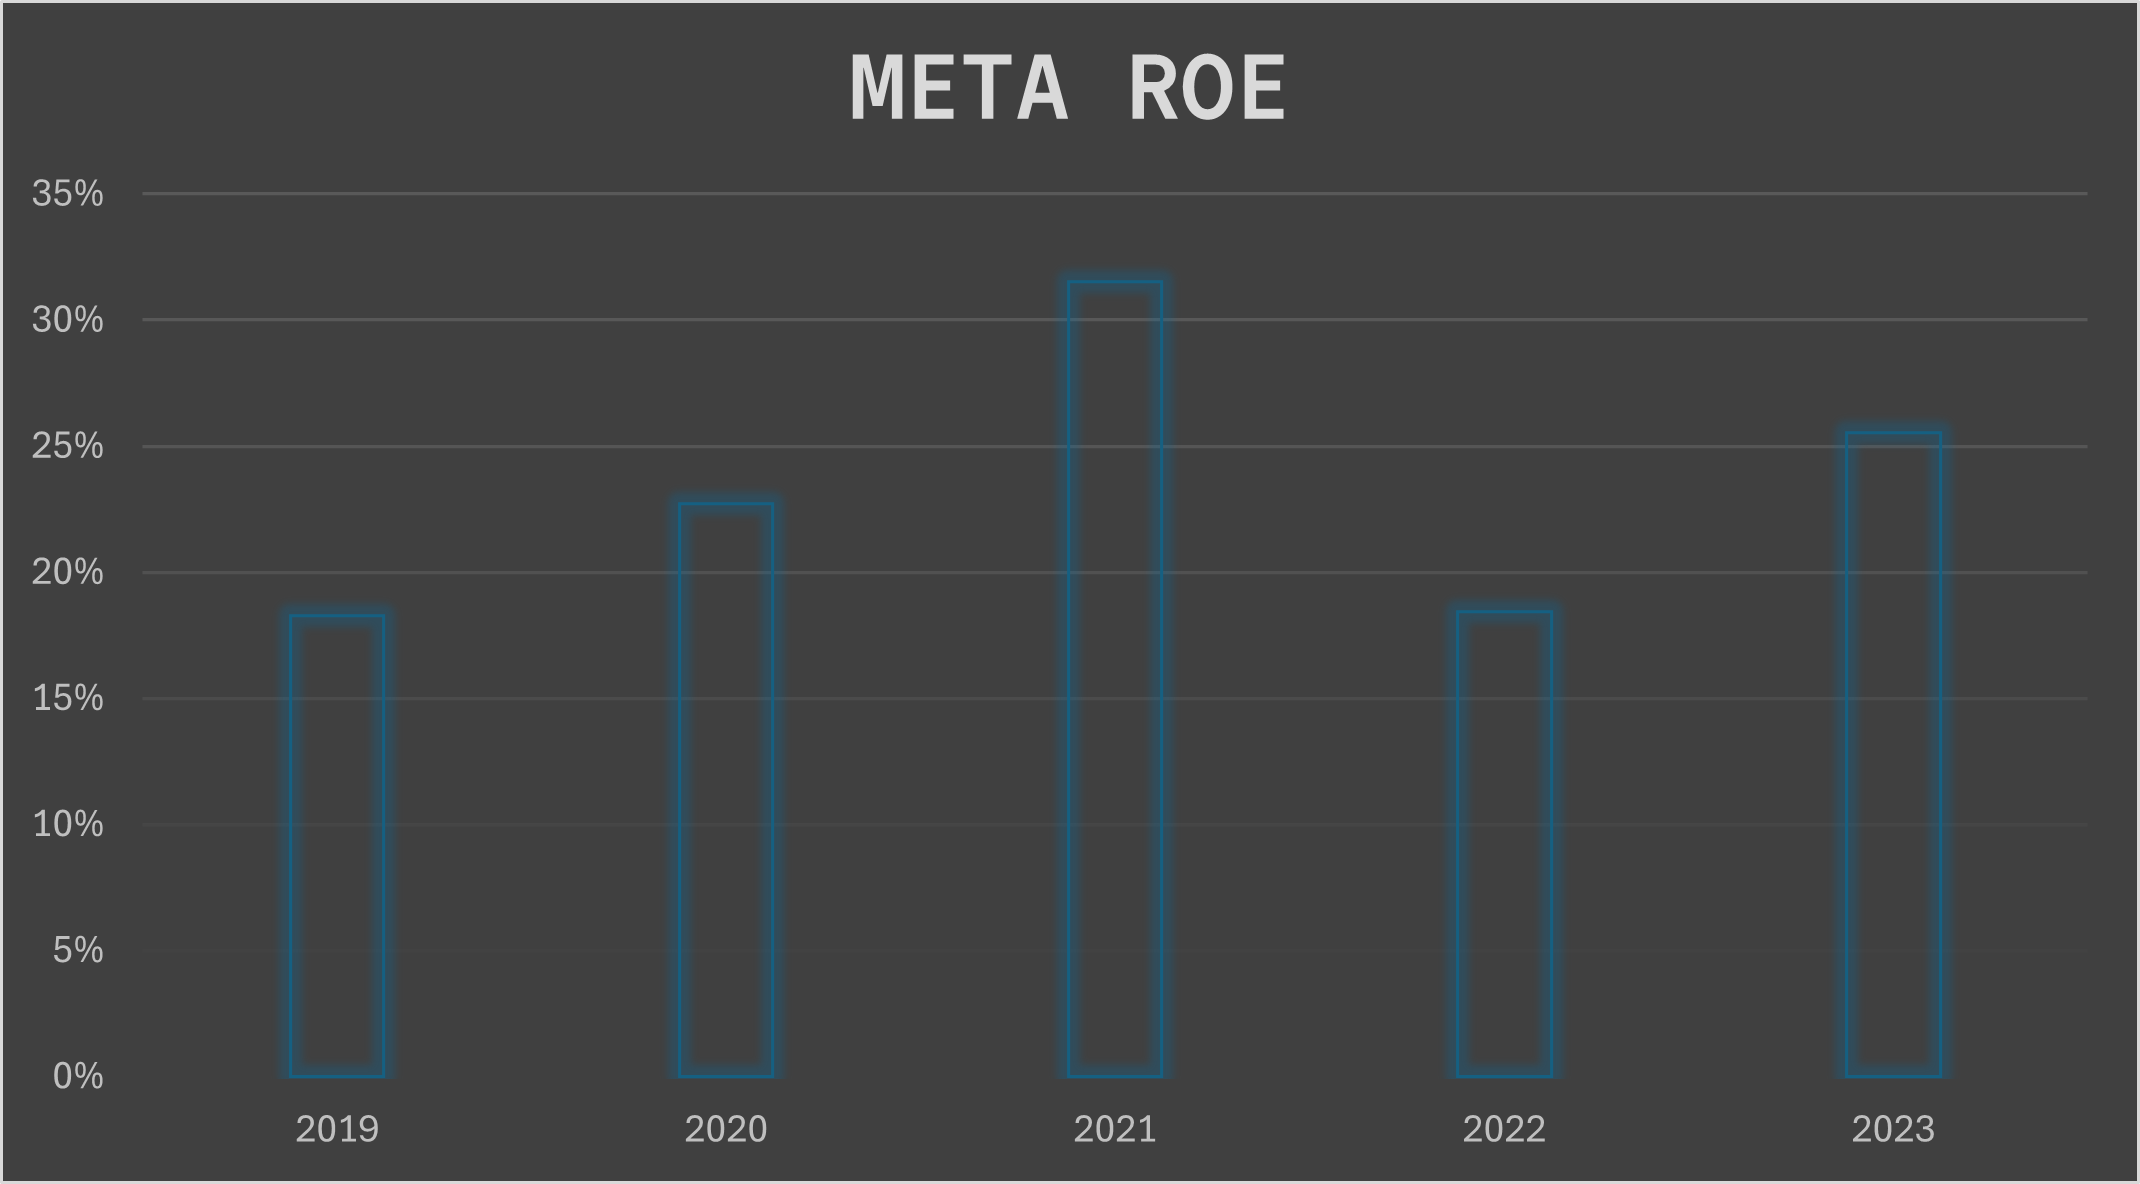
- Average ROE: 23%
- Indicates strong profitability, but shows some volatility.
- Fluctuations may be due to market challenges and heavy investments in new technologies (e.g., metaverse).
5. Google
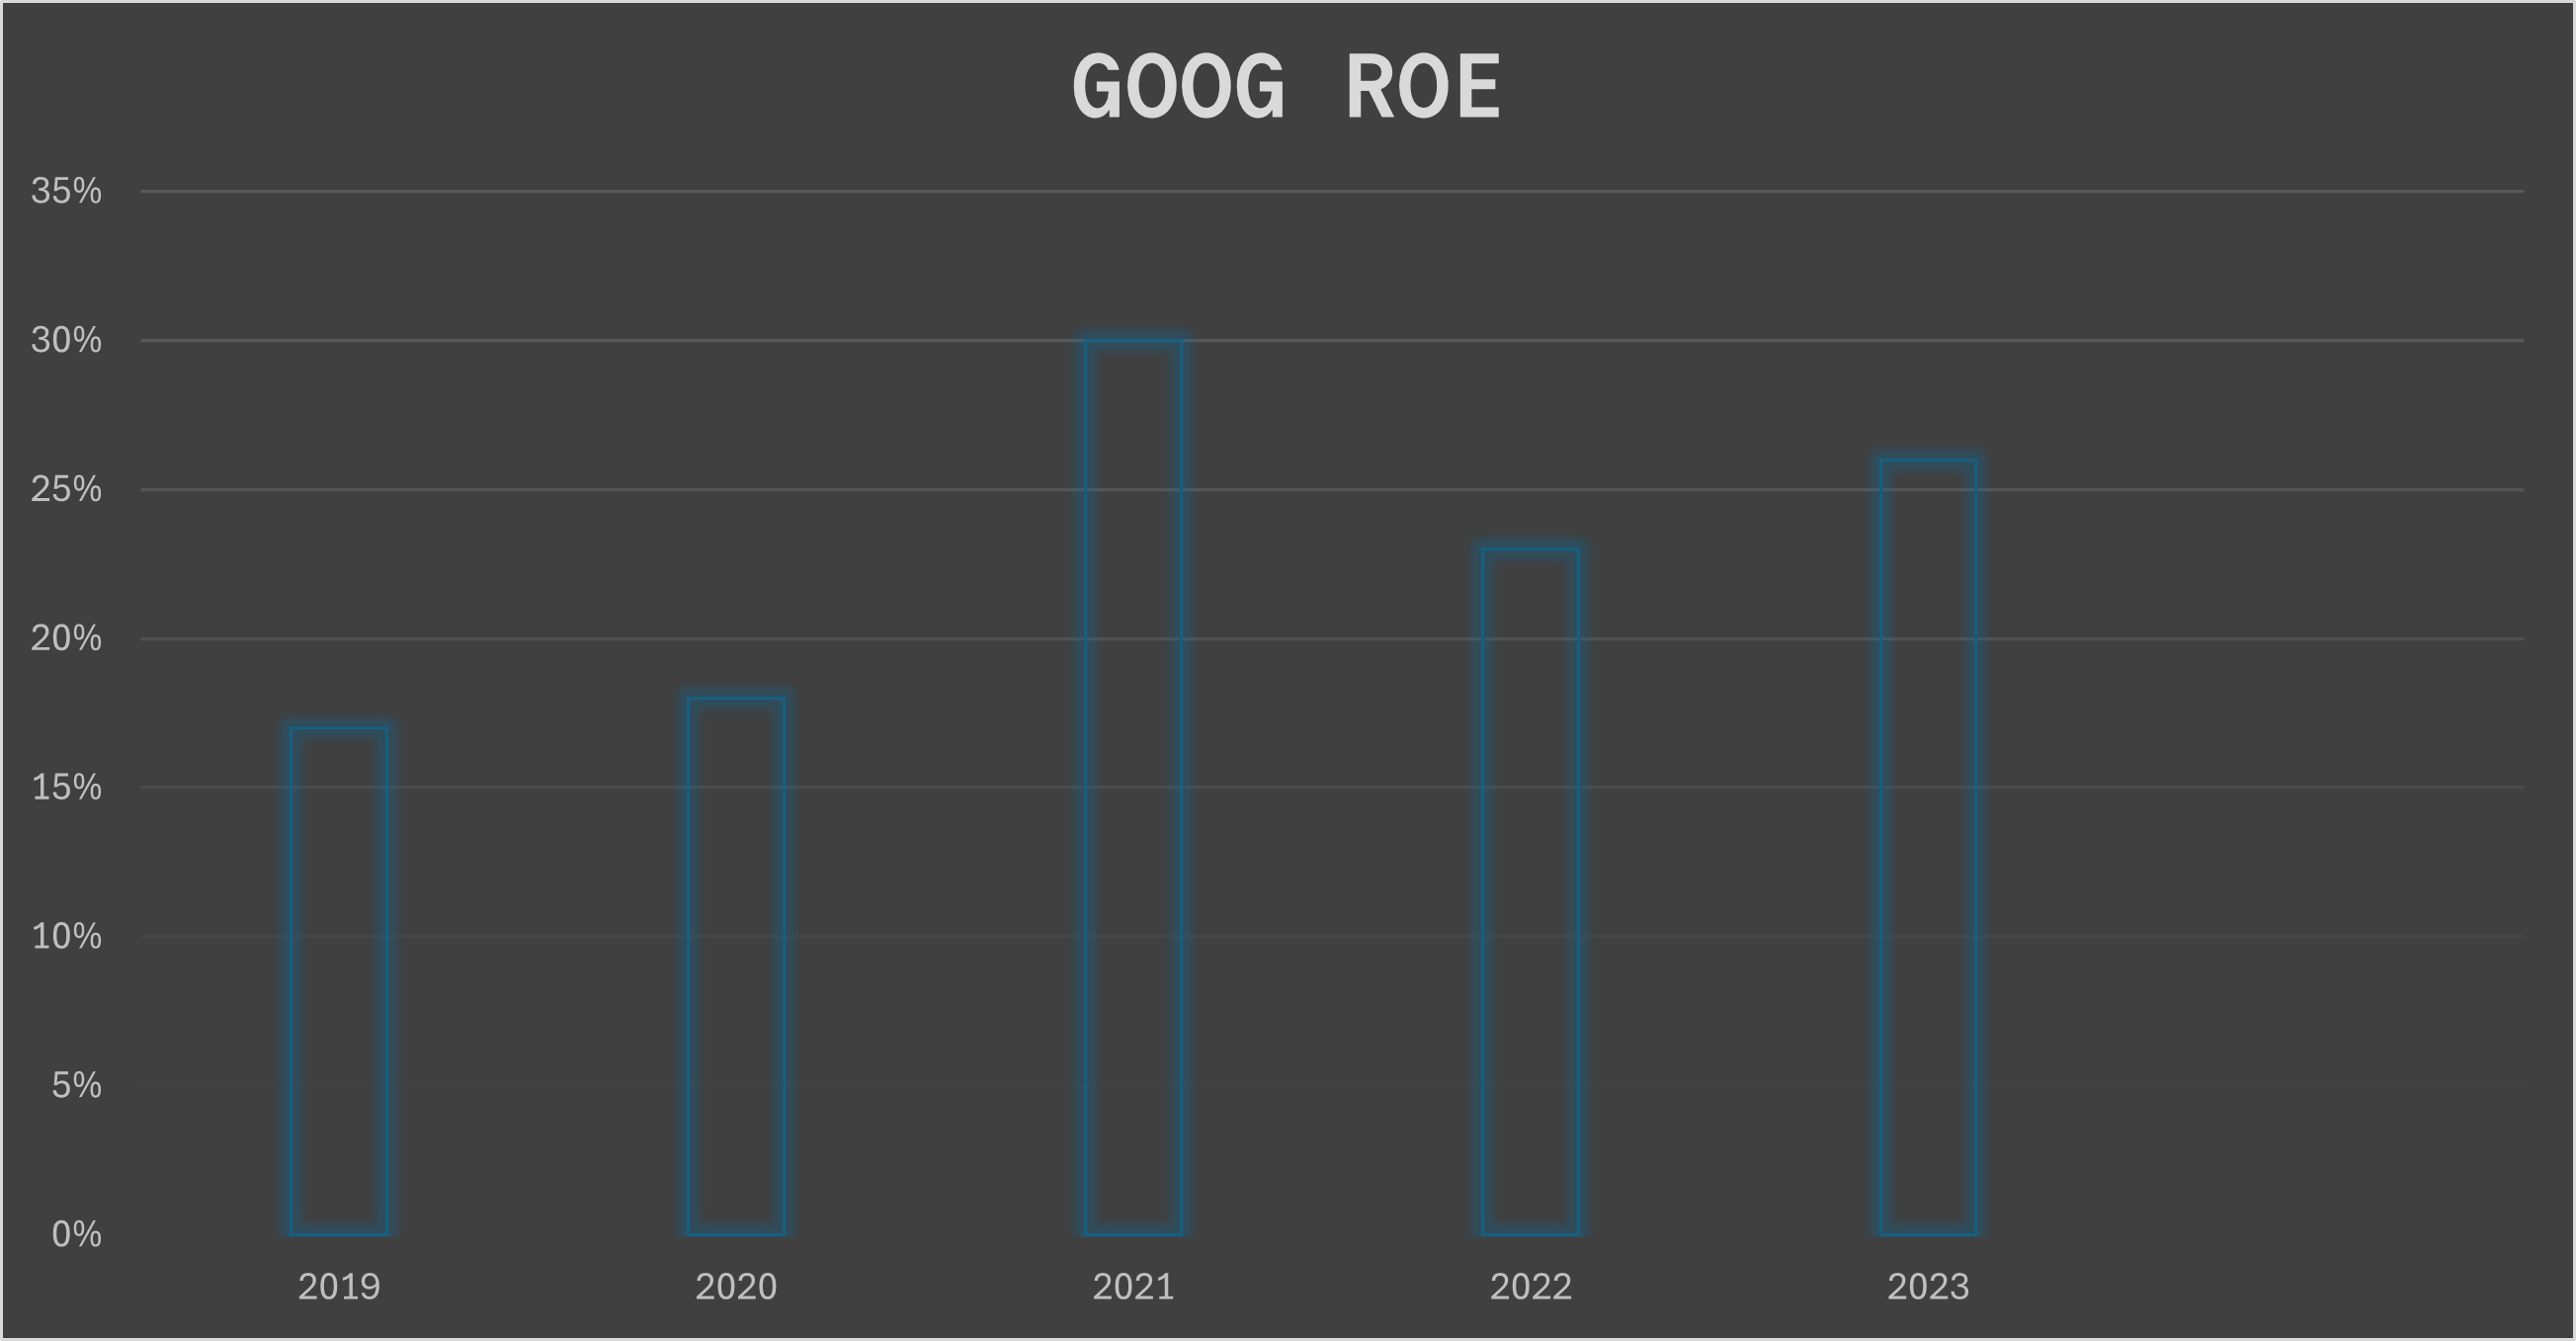
- Average ROE: 23%
- While lower than some peers, still indicates solid profitability.
- May reflect Google's heavy investments in various "moonshot" projects and R&D.
Key Insights:
- All five companies maintain double-digit ROEs, indicating strong profitability and efficient use of shareholder equity.
- Apple leads with an exceptionally high ROE, followed by Microsoft and Nvidia.
- Meta and Google, while having lower ROEs compared to their peers, still show strong performance.
- Nvidia's upward trend in ROE is noteworthy, potentially indicating increasing efficiency and market dominance.
- The variations in ROE among these tech giants may reflect different stages of maturity, investment strategies, and market positions.
It's important to note that while ROE is a useful metric, it should be considered alongside other financial indicators for a comprehensive understanding of a company's performance. Factors such as share buybacks, debt levels, and industry-specific characteristics can influence ROE values.
Additional Professional Insights on ROE Analysis
Trend Analysis
Additional Professional Insights on ROE Analysis
Trend Analysis
- Apple: ROE has fluctuated but remained high, peaking in 2021 at over 100% before slightly declining.
- Microsoft: Shows a steady upward trend, increasing from around 35% in 2019 to over 40% in 2023.
- Nvidia: Dramatic increase from about 20% in 2019 to over 50% in 2023, showing significant improvement.
- Meta: Volatile trend, with a sharp decline in 2022 followed by a recovery in 2023.
- Google: Relatively stable, with a slight downward trend from 2019 to 2022, but showing signs of recovery in 2023.
Industry Benchmarking
The average ROE for the S&P 500 typically ranges from 13% to 15%. The tech sector often sees higher ROEs, with a typical range of 15% to 20%. All five companies in our analysis outperform these benchmarks, indicating strong performance relative to the broader market and their sector.
Factors Affecting ROE
- Apple: High profit margins and extensive share buyback programs contribute to its exceptionally high ROE.
- Microsoft: Consistent profit growth and efficient asset utilization drive its strong ROE.
- Nvidia: Rapid revenue growth and expanding profit margins, particularly in the AI sector, have boosted its ROE.
- Meta: Investments in new technologies and market challenges have impacted its ROE stability.
- Google: Substantial R&D investments and diversification efforts may be moderating its ROE compared to peers.
Limitations of ROE as a Metric
While ROE is a valuable metric, it has limitations:
- It doesn't account for debt levels; companies with high debt can artificially inflate ROE.
- Share buybacks can boost ROE without improving operational efficiency.
- It doesn't consider the risk associated with generating returns.
- ROE can vary significantly across industries, making cross-industry comparisons challenging.
Forward-Looking Statements
Analyst expectations for future ROE:
- Apple: Expected to maintain high ROE, though possibly not at current levels due to market saturation in key product categories.
- Microsoft: Projected to continue its upward ROE trend, driven by cloud services growth.
- Nvidia: Anticipated to sustain high ROE due to continued demand in AI and data center markets.
- Meta: Expected to see ROE improvements as investments in the metaverse potentially begin to yield returns.
- Google: Projected to maintain stable ROE with potential upside from AI initiatives and cloud services growth.
Note: Forward-looking statements are based on current market analysis and are subject to change based on various factors including market conditions, technological advancements, and global economic factors.
4. Interactive Streamlit Dashboard
Experience our financial analysis through an interactive dashboard built with Streamlit. Explore key metrics, visualize trends, and gain deeper insights into the performance of top tech companies.
Launch Streamlit Dashboard